


Why understanding wet weather impacts on collection systems has never mattered more

Updated: Sep 29

By Greg Johnston
For the engineers and operators responsible for sanitary and combined collection systems, storms and flooding are more than climate news. They are an operating reality. Storms that once fell outside historical design assumptions are now routine visitors, and the gap between what a system was built for and what it is being asked to handle is widening. Understanding that gap, event by event, is the foundation of asset management, regulatory compliance, and public trust.
The numbers tell a stark story. Data from the Insurance Bureau of Canada (IBC) shows that since 2019 the number of personal property damage claims in Canada is up 115%, and the cost of repairing and replacing personal property damaged by severe weather is up 485%. In 2024, insured damage from severe weather reached $8.5 billion – the costliest year on record in Canada.
By placing rainfall intensity, duration, and accumulation data directly alongside system response data (depth, velocity, flow, and capacity status) in a single view, infinitii flowworks lets engineers see cause and effect in the same frame. Rather than reconciling two disconnected data sets after the fact, teams can watch a storm unfold and see, in near real time, exactly how their infrastructure performed.
Observations were recorded between May and July 2026 from four storm events experienced by a single monitored trunk sanitary sewer in a southern Ontario collection system.

On 18 July 2026, a fast-moving convective cell delivered 21 mm of rain within one hour, peaking at an instantaneous rate of 53.5 mm/h.
The side-by-side display showed the rain gauge trace spike almost vertically, while the paired depth and velocity sensors tracked the response within the same hour. Depth at the monitored manhole rose from a pre-storm 372 mm to 698 mm. This was the highest level recorded at the site all year.
Peak depth arrived 55 minutes after peak hourly rainfall. Over the event, the site carried 15,414 m³ of wet-weather flow above its dry-weather baseline. All this from just 21 mm of rain.
The operational lesson is compressed timelines. A catchment that concentrates an hour of rain into a single peak leaves under an hour of usable warning. Reviewed a week later from separate rainfall and flow spreadsheets, that response time would be an academic number. Watched live, it is a dispatch decision.

Two months earlier, on 23 May 2026, a slow-moving frontal system delivered 40.8 mm over 21.9 hours. It averaged just 1.9 mm/h, with a peak hour of only 8.3 mm. This meant a lower intensity, but comparable volume to the July storm.
The paired storm-and-response view showed an entirely different signature: a delayed, sustained rise rather than a spike. Flow rose from 190 to 499 l/s, which is 2.6 times expected dry-weather flow. The site carried 16,098 m³ above baseline, which was slightly more than the intense July cell, spread across four times the duration.
Peak depth came 70 minutes after peak rainfall, and depth remained elevated for more than 24 hours after the rain stopped. Critically, the site's capacity ratio peaked at 0.87. This meant it never surcharged, despite receiving nearly twice the rainfall of the July event.
That contrast is the finding. This event is a classic infiltration and inflow signature. Rainfall that enters the system slowly, over hours, through defective laterals and manhole covers, drains away just as slowly. It is a rehabilitation problem, not a capacity problem. This is very hard to isolate from rainfall and flow data reviewed separately after the fact.

On 17–18 June 2026, the same site was hit by the largest storm of the year to date. It received 54.9 mm total rainfall, with 23.6 mm falling in a single hour and instantaneous rates reaching 45.5 mm/h.
This time the system ran out of room. Depth rose from 296 mm to 689 mm. Flow rose from a pre-storm 187 l/s to 702 l/s — 6.8 times the flow the system would have carried at that hour on a dry day. The platform's capacity ratio crossed 1.0 and stayed above it for 185 continuous minutes. It peaked at 1.15, which is 15% beyond the pipe's rated capacity. This meant the surcharge flag was raised for that period of time.
Peak surcharge occurred 40 minutes after peak hourly rainfall. Total wet-weather volume above dry-weather baseline: 22,044 m³.
Across the wider monitored network, every one of the thirteen instrumented sites recorded its highest peaking factor of the year during this storm – between 2.2 and 3.6 times normal. But only this one exceeded capacity.
That single fact, which was visible immediately rather than after a month of analysis, is what separates a network-wide weather event from a site-specific infrastructure deficiency.

Eight days before that storm, on 10 June 2026, the same gauge recorded 9.8 mm in 50 minutes at a peak instantaneous rate of 40.2 mm/h – very nearly the intensity of the 18 June storm that pushed the site past capacity.
The system barely noticed. Capacity ratio peaked at 0.63. No surcharge. Flow rose to roughly the level of an ordinary weekday peak, and total wet-weather volume was 3,507 m³, which was about one-sixth of the June extreme.
It is not the instant that matters, but the hour. The 10 June and 17 June storms peaked at almost the same instantaneous rate – 40.2 against 45.5 mm/h – yet one was a non-event and the other held the pipe over capacity for three hours. What separated them was the peak hour: 9.8 mm against 23.6 mm. Across all 32 catalogued storms at this site there is no exception: every storm that put the pipe over capacity delivered at least 11.4 mm in its heaviest hour, and every storm that did not stayed at or below 10.5 mm. Total rainfall does not separate them: the May storm delivered 40.8 mm without surcharging, while a 20.5 mm storm did. This is the single most useful finding in the four-storm set, and it is invisible in any analysis that ranks storms by intensity alone, or that treats every heavy-rainfall warning as an equivalent operational threat.
Turning events into priorities
Individually, each of these events tells an operational story. Collectively, and over time, they tell a planning story. When storm and response data are consistently captured and visualized side by side across dozens or hundreds of events, patterns emerge that a single event report never could.
In this network, a screen of 32 catalogued storms against 13 monitored sites produced a clear ranking. One site exceeded capacity on four separate storms. A second reached 89% of capacity but never crossed it, and a third reached 74%. The remaining ten never exceeded 46%. That the order barely moved from storm to storm is what makes it a defensible basis for capital planning: the ranking is measuring the condition of the infrastructure, not the severity of any one storm. Certain sites exceed capacity disproportionately relative to storm intensity, signaling undersized pipe or blocked infrastructure. Others respond predictably to volume but not intensity, pointing to infiltration and inflow rather than capacity. Still others perform well under historical storm intensities, but begin to fail as the same rainfall depths arrive in shorter windows.
This is where reporting and visualization earn their keep. A collection system is a portfolio of thousands of assets, and no municipality has the capital budget to upgrade all of them at once.
Engineers need a defensible way to rank which sections of pipe, which flow control structures, and which pump stations most urgently require intervention. By reviewing capacity-exceedance history against classified storm severity, teams can distinguish infrastructure that failed under a genuinely extreme, low-probability event from infrastructure that is failing under increasingly common storms. The latter being the clearer candidate for near-term capital investment.
That ranking, grounded in actual system behaviour rather than assumption, is what allows limited rehabilitation and upsizing dollars to be directed where they will reduce the most risk in the fastest timeframe. It also gives engineers a credible narrative to bring to municipal politicians and the public. Not simply that a storm caused a problem, but precisely how the system responded, where it held, and where it didn't.
From visibility to action
Seeing the problem clearly is the first step. Responding to it quickly, and proving that response after the fact, is the next one. Infinitii flowworks can help with wet-weather management.
During a major storm event, every minute without actionable information is a minute an operations team is working blind, and capacity exceedances carry real consequences. These include regulatory exposure, environmental harm, and costly post-event investigations.
Historically, achieving real-time visibility, fast response, and defensible documentation simultaneously – using existing staff and existing data – has been out of reach for most municipalities. infinitii flowworks closes that gap. A live, colour-coded GIS map shows every monitored site across the network at a glance, with consistent threshold logic (green, yellow, orange, red), so severity is never a matter of interpretation.
Selecting any site opens a drilldown with live depth, velocity, flow, and 24-hour rainfall readings, alongside pipe fill graphics and a rolling 30-day event history.
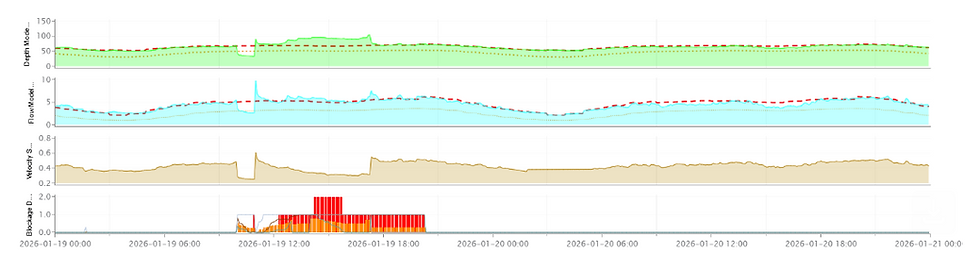
Beneath that view sits a modelling layer that matters just as much. Alongside every measured channel, the platform can also display modelled depth and flow, an expected dry-weather flow profile, and a decomposition of the wet-weather signal into groundwater infiltration and rainfall-derived inflow.
The figures quoted in the above-mentioned storm events are not raw flow totals. They are measured flow, minus what the system would have carried on a dry day, which is the number that actually drives rehabilitation decisions. The same layer flags depth, flow, and velocity anomalies automatically. This means a failing sensor is caught in hours, rather than surfacing a month later as an unexplained gap in an annual report.
Critically, this capability is built on the data infrastructure most utilities already have. It works with existing raw and final channel data, rain gauges, and GIS asset layers, requiring no new sensors or separate platform to manage.
For municipalities watching storm severity indices climb and emergency declarations become more frequent across the country, visibility during the event, classification of its severity, and audit-ready documentation afterward can turn a growing climate risk into a manageable, defensible engineering program.
As storms continue to intensify and shift geographically, the municipalities best positioned to protect their infrastructure and their communities will be the ones that can see, in real time, exactly how their collection systems respond to changing weather events.
Greg Johnston is President of infinitii ai inc.
Acknowledgment: This article first appeared in the October issue of Environmental Science & Engineering Magazine


Comments